


Two years ago, I announced that I was switching to paid subscriptions. In that piece, I said that my move to Substack back in 2022 was “an incredibly positive move.” I continued, saying that the platform allows “me to write what I want, when I want, how I want, with the photos and graphics that I choose. After 38 years as a reporter, that freedom is delicious beyond measure.”
Since then, my love — and that’s the right word — for Substack has only increased. To celebrate this anniversary, I am publishing five of my favorite charts for free. I’m also offering new subscribers a 30% discount on an annual subscription. That means new subscribers will pay $70 instead of $100. To get the discount, which ends on Saturday, please click here.

This Substack depends solely on readers like you. I don’t take advertisements or money from any outside sources. Your paid subscription lets me keep working as an independent journalist covering the most important stories in energy, power, innovation, and politics. Your support helps fund ongoing updates to the Renewable Rejection Database and the Data Center Rejection Database, both of which I have purposely kept online, free, and searchable. Those databases are the only ones of their kind. Your paid subscriptions also allow me to continue my clear-eyed reporting on the SMR sector, including updates to SMR Intelligence US and SMR Intelligence Global. In fact, I updated the latter a few hours ago by adding a new company based in Finland. (h/t to JG.)
I am incredibly lucky to do what I do. My work is my purpose and my passion. To my existing subscribers, and I hope, to my new paid subscribers, I truly appreciate your support.
Now on to the charts.
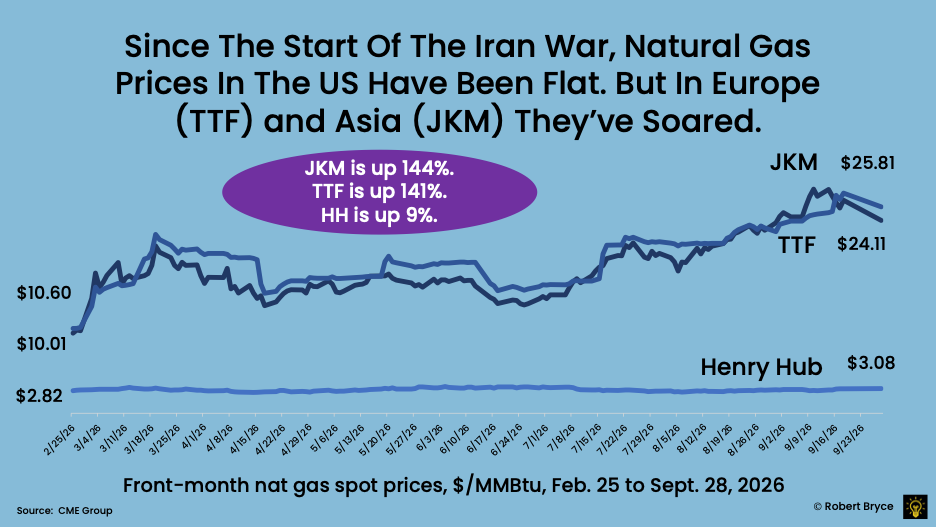
Most pundits and news outlets are focusing on how the war on Iran has impacted oil prices. But the soaring price of natural gas is arguably just as important as the price of oil. As shown above, since the start of the war, natural gas prices in Asia (JKM) and Europe (TTF) have more than doubled. Meanwhile, the US spot price at Henry Hub has been almost unchanged. As a result, Asian and European gas consumers face huge price increases for an irreplaceable fuel. Further, Asian and European buyers are now competing for LNG cargoes as the European Union prepares for winter with the lowest gas storage levels in 15 years.
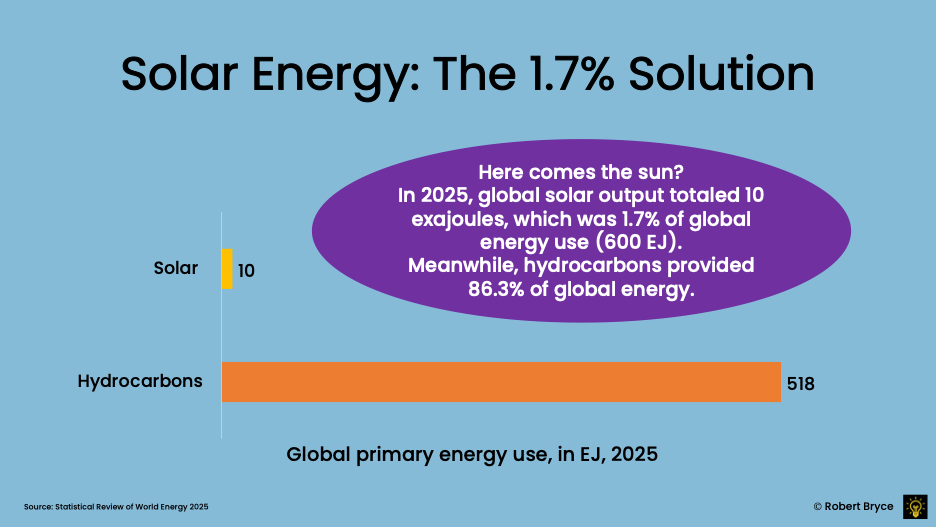
Climate activists never tire of talking about solar energy. And yes, solar is growing rapidly. But it remains a bit player in the global energy economy. As shown above, in 2025, solar provided just 1.7 percent of global energy use. As I explained in July in “Where The Sun Don’t Shine,” solar energy deployment is heavily concentrated in a handful of countries. In fact, just eight countries account for more than 76% of the world’s solar energy production.
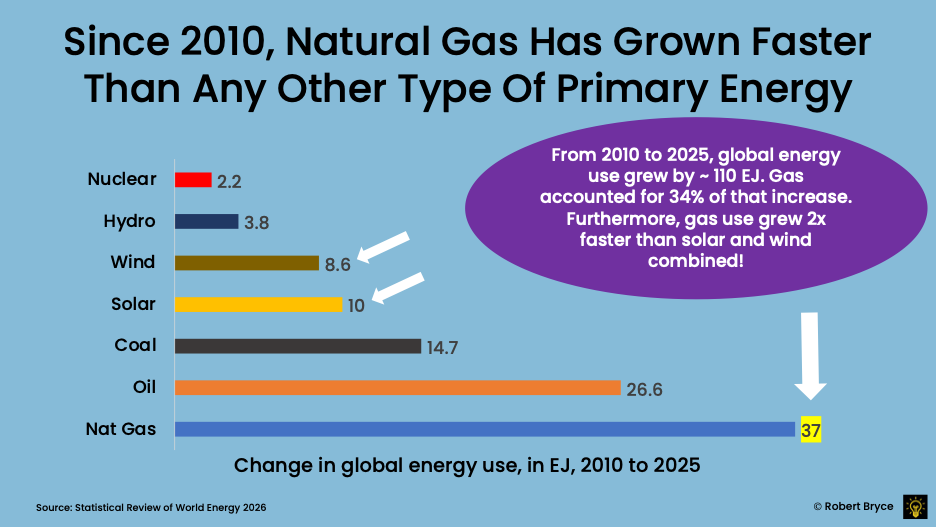
I have been promoting the idea of N2N — natural gas to nuclear — for two decades. While the resurgence of nuclear energy is taking longer than I’d like, there’s no arguing about the global surge in natural gas production and use. As shown above, gas has been the big winner since 2010 and that surge in global production will continue. This year, US gas production will hit another new record, 122 billion cubic feet per day. That’s more than double the 55 Bcf/d recorded back in 2007.
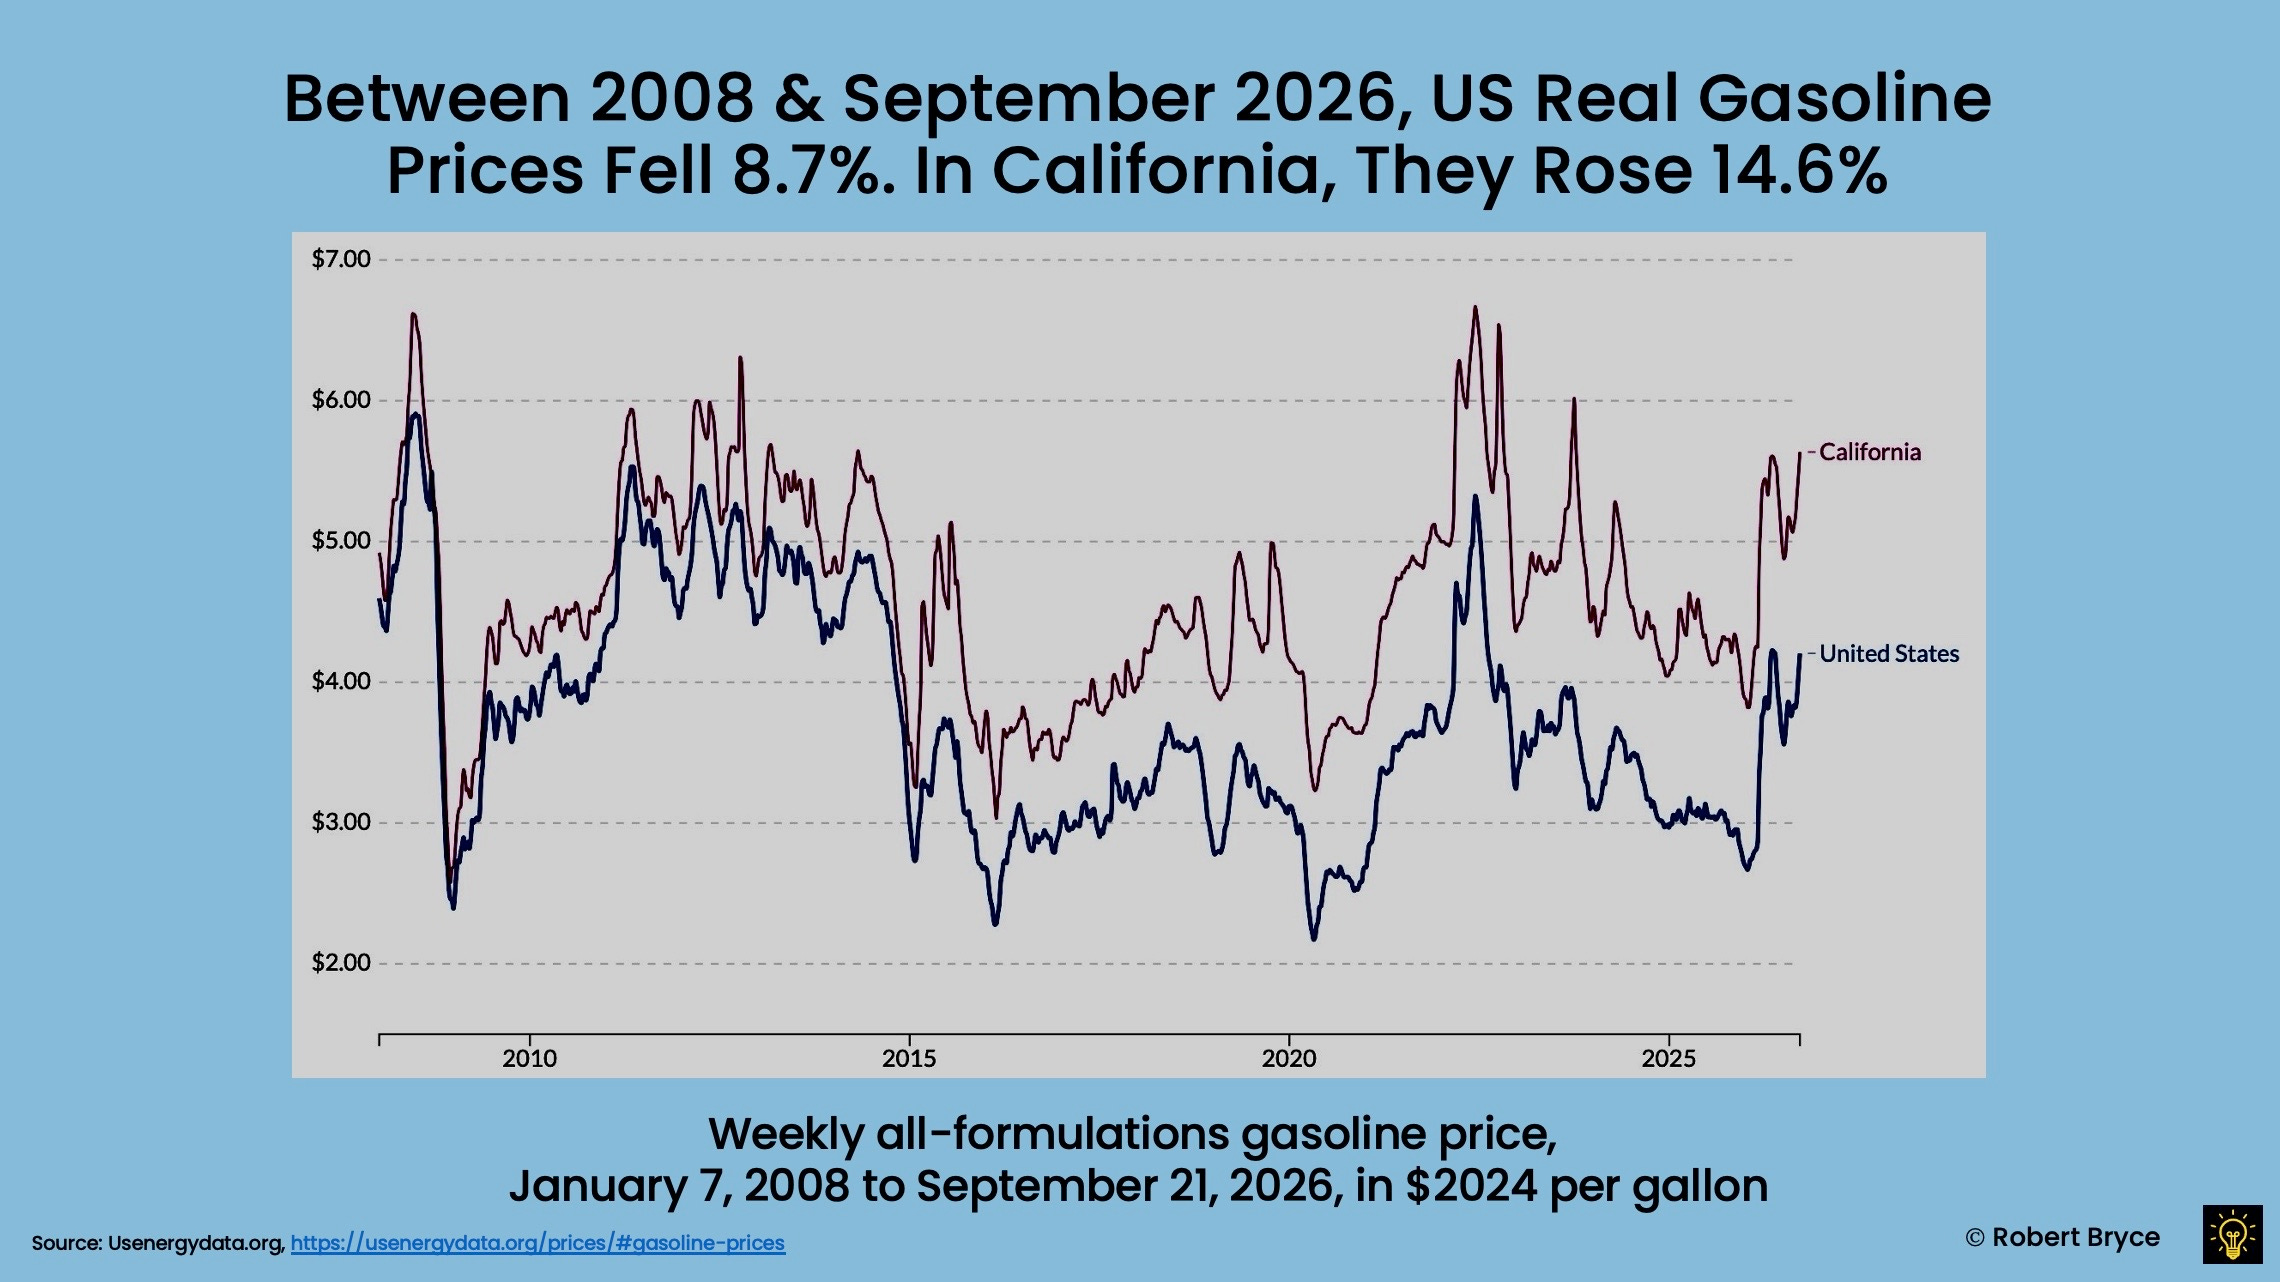
Be glad you don’t live in California. As I noted earlier this month in “California Is So Screwed,” consumers in the Golden State are getting hammered by exorbitant energy costs that are the result of the state’s inane climate policies. I made the chart above using an excellent new tool called the US Energy Data Platform. As you can see, when measured on an inflation-adjusted basis, real gasoline prices across the US declined 8.7% between January 2008 and September 2026. That’s not the case in California, where motorists have seen gasoline prices rise 14.6%. [NOTE: I corrected and updated this chart after it was published. The earlier chart had the wrong numbers for the US and CA.]
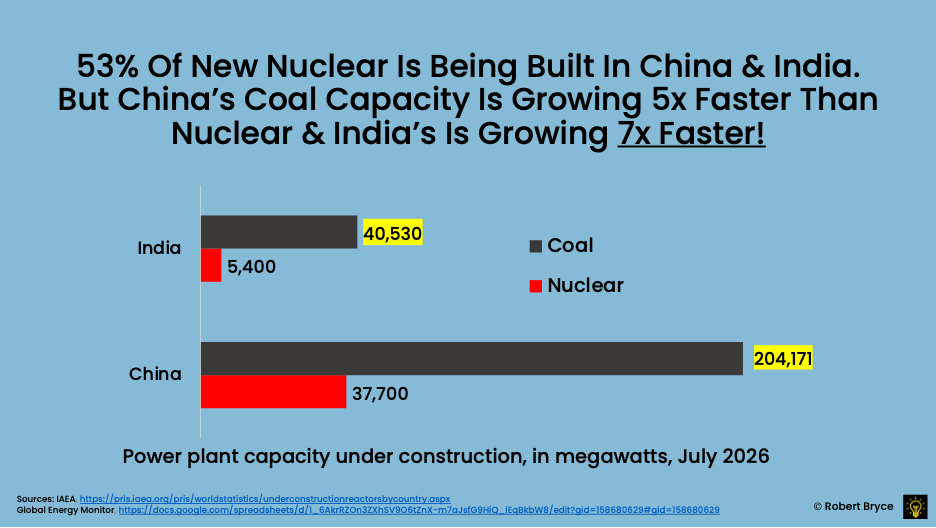
I vividly remember my first visit to the P&M McKinley mine on the Navajo reservation, just east of Window Rock, Arizona. I was 19 years old. I was stunned by the mine’s scale, the machinery, and the massive amount of material being moved. That mine is now closed. Since then, I have visited the Cardinal Mine (an underground coal mine in Kentucky) and the world’s largest coal mine, the North Antelope Rochelle Mine, in Wyoming. Those experiences have shaped how I view coal, which still generates about 33% of the world’s electricity. As shown above, India and China are building huge amounts of new nuclear capacity. But that new nuclear capacity is dwarfed by the amount of coal capacity now under construction. Of course, coal use in the US has declined dramatically over the past few years. But plenty of other countries are still burning coal and, as I explained last month, “The US isn’t really using less coal. Instead, it has exported its coal use to Asian countries,” including China, Vietnam, India, Indonesia and Malaysia.

I know that I promised five charts. Therefore, consider this one a lagniappe. I am proud of all four of these mini-documentaries. You can check them out on my YouTube channel.
Before you go:
As always, please click that ♡ button. And please share and subscribe. Thanks.

I just re-subscribed for another year.
It's really a bit more than I can afford comfortably, but I had followed Robert Bryce for several years, through his podcast, when his work was free, and in the end I just do not want to be without his particular slant on things, especially his writings on alternative forms of energy, esp. eg nuclear.
And wind. Like him, I HATE wind power!
Thank you, Robert, for your very individual take on climate.
Coal is industrial scale heat. You need it to process metals (steel aluminum, copper et al) and to perform heavy industrial process on the metals like forging, casting, and forming. To process industrial scale chemicals, you need heat.
We may reduce or cease heavy metal processing in the US... there is a demand, it won't go away, and the metals will be produced somewhere else, and coal will be integral.
Germany may reduce or cease industrial chemical processing... this is demand, it won't go away, and the chemicals will be produced somewhere else, and coal will be integral.
Only a couple of examples. But. Consider that massive infrastructure is required to harness power from coal, petroleum, and natural gas. Infrastructure that takes 5 -10 20 years to build. And we have been demonizing energy for the last 10 - 20 years and infrastructure is way, way underinvested. Combine that with current warfare and its destruction. Add the superstitious religious nonsense of NetZero and Energiewende coming out of places like Germany and Californian and we have a recipe for disaster.