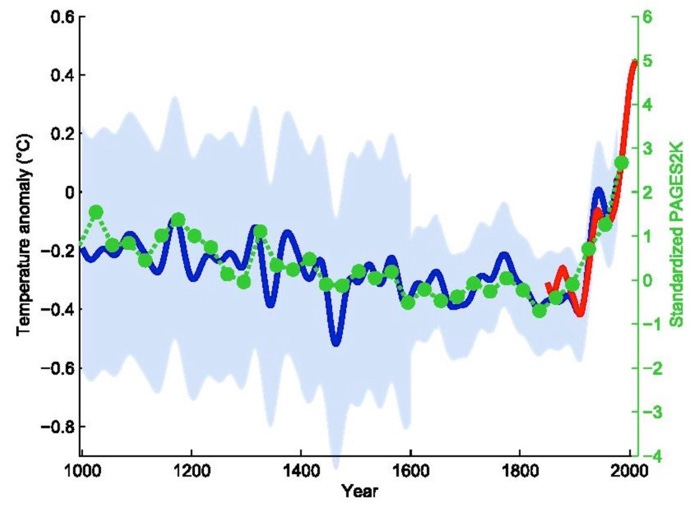
Here's The Real Hockey Stick
New Treasury Department numbers show that soaring federal handouts for wind & solar dwarf all other energy-related provisions in the tax code and will cost taxpayers $421 billion by 2034.
In 2005, Scientific American published an article saying that the hockey stick graph published a few years earlier by Michael Mann, an academic who now works at the University of Pennsylvania, had become “an iconic symbol of humanity’s contribution to global warming.” The article continued, saying the image, which shows a looming spike in temperature, has become “a focal point in the controversy surrounding climate change and what to do about it.”
That was an understatement.
Mann and the hockey stick have become defining examples of the politicization of climate science. The hockey stick played a prominent role in Mann’s defamation lawsuit against author and journalist Mark Steyn. Last year, a jury in Washington, DC, awarded Mann $1 million in that case. During the trial, Canadian journalist Terence Corcoran declared the hockey stick has become “a powerful and effective piece of supposed evidence for makers of climate policy and a near-religious icon that activists continue to revere.”

While scientists and journalists can argue about Mann’s hockey stick, his methods, greenhouse gas emissions, and temperature forcings, there can be no argument about the staggering cost of the subsidies Congress has given to Big Wind, Big Solar, and other alt-energy outfits in the name of climate change. In late November, the Treasury Department published the newest edition of its annual report on tax expenditures, which it says are “revenue losses attributable to provisions of Federal tax laws.”
What do those Treasury reports show? A hockey stick.
The Inflation Reduction Act, which became law in 2022 thanks to a single vote cast by Kamala Harris, has turned into a run on the Treasury. As seen at the top of this article, the IRA has fueled a hockey stick of gradual — and then exploding — federal tax expenditures for the investment tax credit and production tax credit. Those credits, which are the principal drivers behind the deployment of wind and solar energy, and a handful of other forms of alt-energy, are, by far, the most expensive energy-related provisions in the federal tax code. Between 2025 and 2034, the ITC and PTC will account for more than half of all energy-related tax provisions. And that total does not include the tax credits for electric vehicles.
This alt-energy tax credit orgy is, of course, being justified by claims that the expenditures will help avert catastrophic climate change. The Natural Resources Defense Council (2023 revenue: $193 million) has claimed the IRA will cut “climate-warming emissions” while “reducing Americans’ electricity bills” and “creating hundreds of thousands” of jobs.
The NRDC’s claims are — to put it charitably — dubious. Meanwhile, the federal debt is $36.3 trillion. The incoming Trump administration says it wants to cut federal spending. If that’s true, Elon, Vivek, and their DOGE allies should start by looking at the real climate hockey stick.
I compiled the Treasury tax expenditure data from 2015 to today. Here’s a deep dive into those numbers with five fab charts.
Keep reading with a 7-day free trial
Subscribe to Robert Bryce to keep reading this post and get 7 days of free access to the full post archives.


