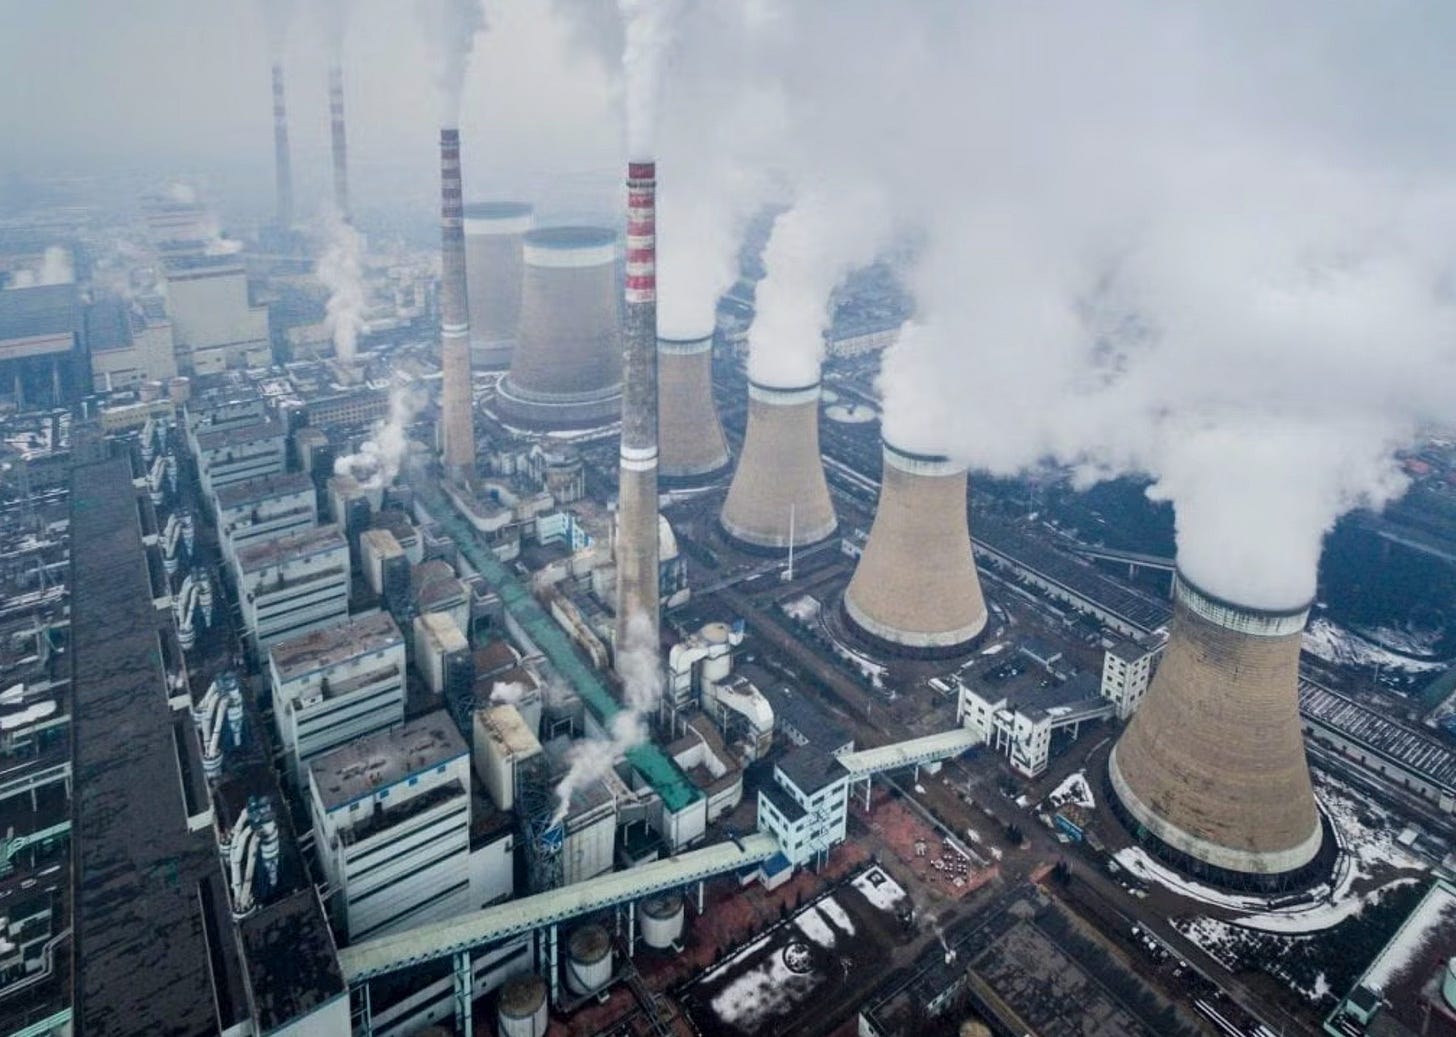
More Coal Reality, With Seven New Charts
Global coal-fired capacity keeps growing. Plus, charts on China’s staggering electricity use, alt-energy spending, and Minnesota’s impossible CO2 target.

I’ve had a busy summer with lots of travel and speaking engagements. I’m back in Austin for a couple of weeks and am happily catching my breath, and catching up on my reading and research. Today’s piece features seven new charts. The first looks at the staggering quantity of new coal-fired capacity currently under construction worldwide in comparison to new nuclear capacity. I also have charts on coal- and gas-fired capacity in China and India, a chart illustrating China’s soaring electricity use, as well as one on global energy investment, and two charts on the CO2 silliness in the Land of 10,000 Lakes.
Let’s take a look.
Keep reading with a 7-day free trial
Subscribe to Robert Bryce to keep reading this post and get 7 days of free access to the full post archives.


