Natty Nation: These 11 Charts Show Why The U.S. Is A Natural Gas Superpower
...And why gas is a strategic, irreplaceable fuel for the U.S. and Europe.
Last month, Grist published a 5,000-word article by one of its “climate reporters” that lamented the difficulty of trying to “electrify everything” in the “green, two-story colonial at the end of a cul-de-sac in Burlington, Vermont,” that the reporter shares with his wife. The article “Emission Impossible” was a tiresome exercise that went into minute detail about the cost of induction stoves (“the least expensive models start around $1,100, or almost twice the price of a basic gas stove”) and heat pump dryers.
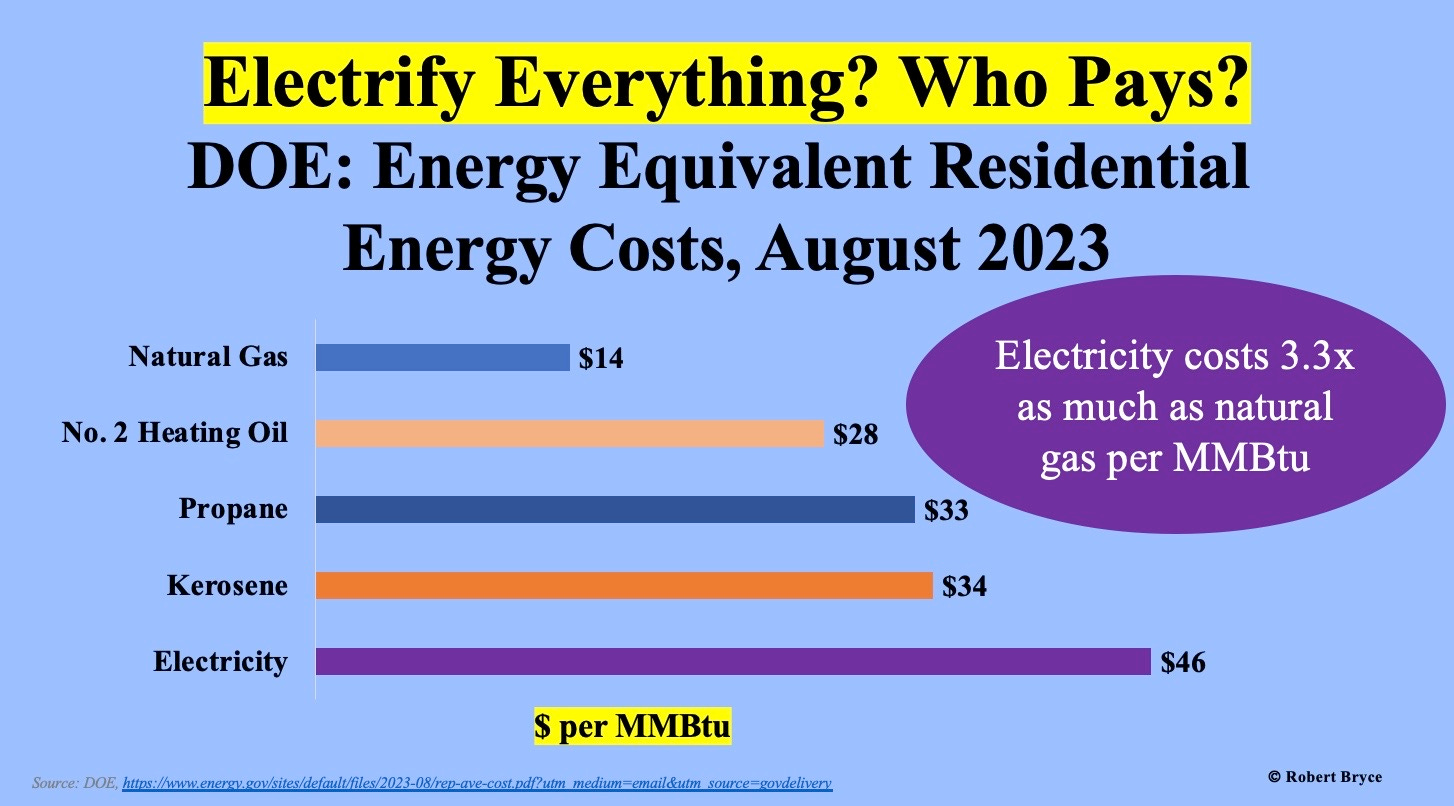
The writer then went through the wallet-emptying costs of trying to replace their boiler (around $20,000) and the higher cost of heating with electricity than with gas (“We’d spend $1,700 annually compared to the $1,100 or so we spend burning gas to keep warm.”) And then there was the cost of upgrading their electric service, cutting holes in their attic and ceilings, and sundry other tasks that had to be done to, as the writer put it, wean “ourselves off natural gas.” But the effort was worth it, the reporter claimed, because “from a climate perspective...getting rid of gas is a bonanza.”
Yes, well.
Given the extent of energy poverty around the world, I’d guess that one or two billion people would be happy to switch places with that Grist reporter and live in that very same “green, two-story colonial at the end of a cul-de-sac” and in doing so, endure the misfortune of having to use natural gas. However, the article reflects the ongoing legacy media lovefest with the claim that attempting to electrify everything will save us from catastrophic climate change.
The notion that the U.S. should get rid of natural gas or that doing so would be a “bonanza” is — to use a technical term — total bonkers crazy town.
About 47% of all the homes in the country rely on natural gas furnaces for heating. Heating with gas is far cheaper than heating with electricity. Thanks to the shale revolution, private ownership of mineral rights, and hydraulic fracturing, the U.S. is now producing record quantities of gas, and because of that, we have a cost advantage over nearly every other country on the planet. European consumers now pay more than four times as much for natty as their American counterparts. Over the past few years, the U.S. has become a natural gas powerhouse, and the fuel has become an integral, irreplaceable part of our economy. My pal, Doomberg, made that point back in February, explaining that a key reason the U.S. economy has not fallen into recession is because it’s increasingly fueled by cheap natural gas. As the famed green chicken explained, “Given the ever-increasing role of natural gas across vital arteries of the US economy, its price is perhaps even more important than that of gasoline — an under-the-radar consequence of the shale boom.” The chicken continued, “Given the strategic objective of onshoring critical supply chains and the huge competitive advantage that cheap natural gas bestows upon the country, is it any surprise the US manufacturing sector is thriving?... Cheap natural gas is the bedrock of the US economy. It explains much of the country’s economic resilience.”
I have been promoting N2N, natural gas to nuclear, for more than 14 years. If we are serious about reducing CO2 emissions, those two sources are the obvious way forward. I continue to believe in the long-term prospects for nuclear energy. But natural gas is the fuel of the moment. These 11 charts help explain why.
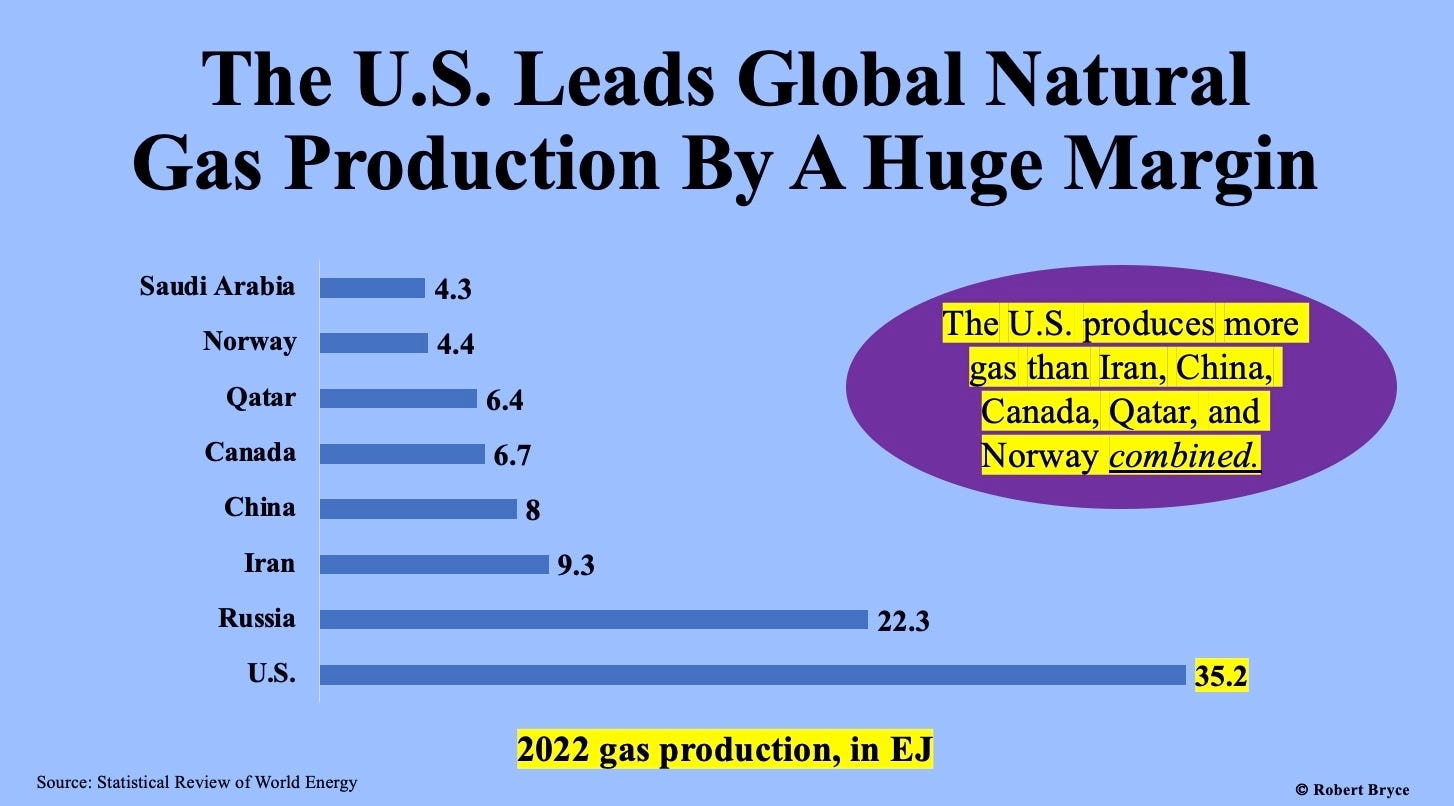
Chart 1
This chart is denominated in exajoules (EJ). An EJ is approximately equal to 1 quadrillion Btu, or the energy contained in 1 trillion cubic feet of natural gas. Regardless of your preferred energy unit, the U.S. natural gas sector is enormous.
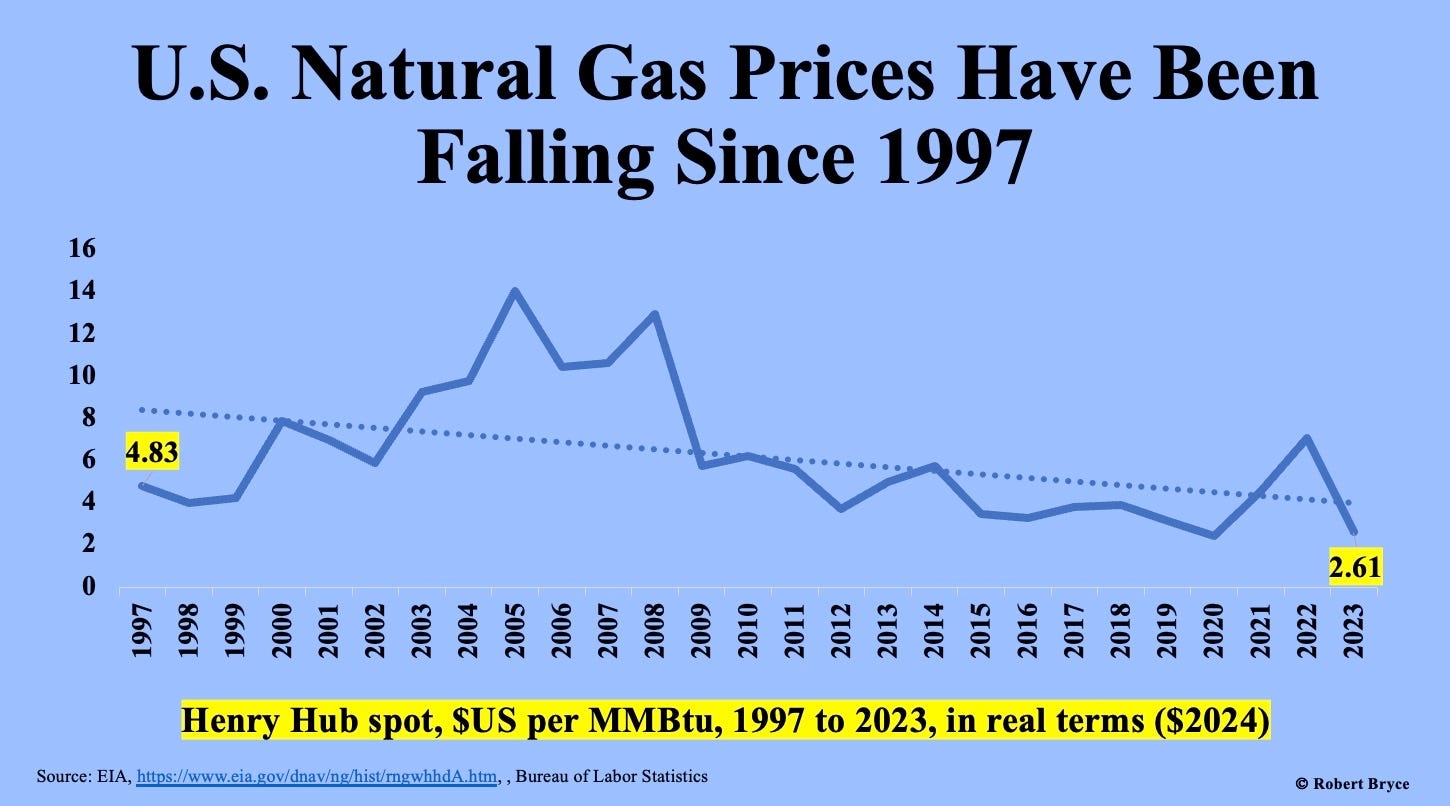
Chart 2
Low-cost natural gas is a boon to U.S. consumers and manufacturers. The current front month price (May delivery) for natural gas at Henry Hub is $1.86 per MMBtu. That same amount of gas at the TTF trading hub in Europe sells for $8.56. In Asia, the price of delivered LNG is $9.58 per MMBtu.
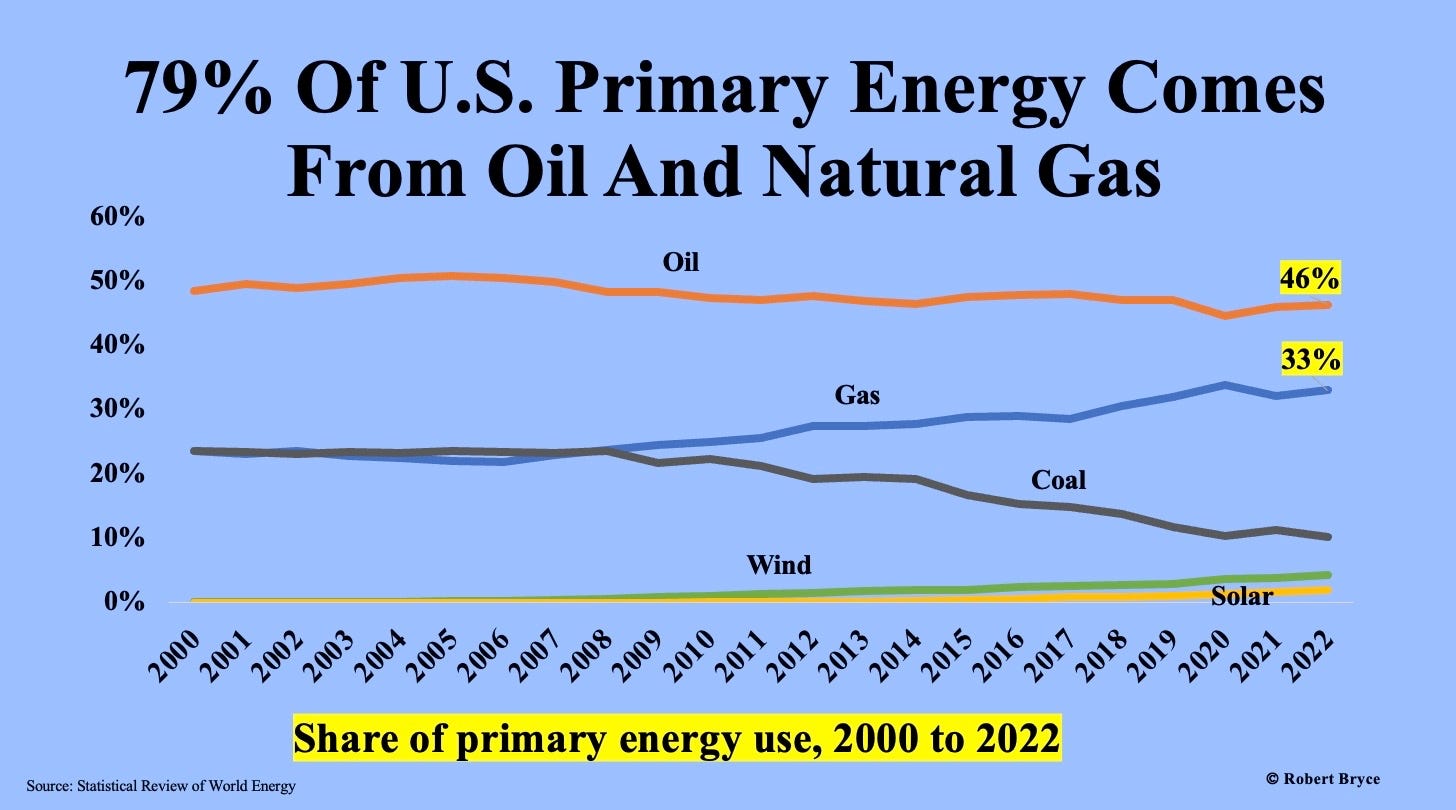
Chart 3
Natty’s share of the energy mix has risen steadily since 2000, when it provided about 24% of U.S. primary energy. This chart shows the decline of coal and the relatively small increases from wind and solar. In 2022, wind and solar provided 6 EJ, or about 6%, of U.S. primary energy. For clarity, this chart omits hydro and nuclear, which provided about 9.7 EJ, or 10%, of U.S. primary energy in 2022.
Chart 4
Natty’s share of the electricity market has grown steadily since 1997. In 2001, when Enron filed for bankruptcy, power burn in the U.S. was about 5.3 trillion cubic feet of gas per year. In 2023, power burn was 12.9 Tcf.
Chart 5
There’s lots of hype about the energy transition, but wind and solar are lagging behind the growth in natural gas.
Chart 6
Ahem.
Chart 7
In 1970, when I was 10 years old, residential gas use in the U.S. was about 5 Tcf/year. Today, despite the addition of more than 100 million Americans, residential gas use is still about 5 Tcf/year.
Chart 8
Gas is an irreplaceable fuel, particularly during the coldest days of winter. During Winter Storm Heather, the gas grid provided more than twice as much energy to Americans as the electric grid. On January 15, it delivered 118 trillion Btu. That’s more than twice as much as was supplied by the electric grid. Further, as seen in the graphic below, 118 trillion Btu is equal to 20.3 million barrels of oil, which is about the amount of petroleum used in the U.S. on an average day. There is no way the grid can deliver that much energy.
Chart 9
As I have explained here many times, including last November, the electrify everything push is a regressive tax on the poor and the middle class.
Chart 10
Europe drove itself into the ditch, and Germany led the way. This chart, which was published by the International Energy Agency in January, shows that in 2019, 47% of Europe’s gas came from Russia. By the end of 2023, that figure had plummeted to 12%.
Chart 11
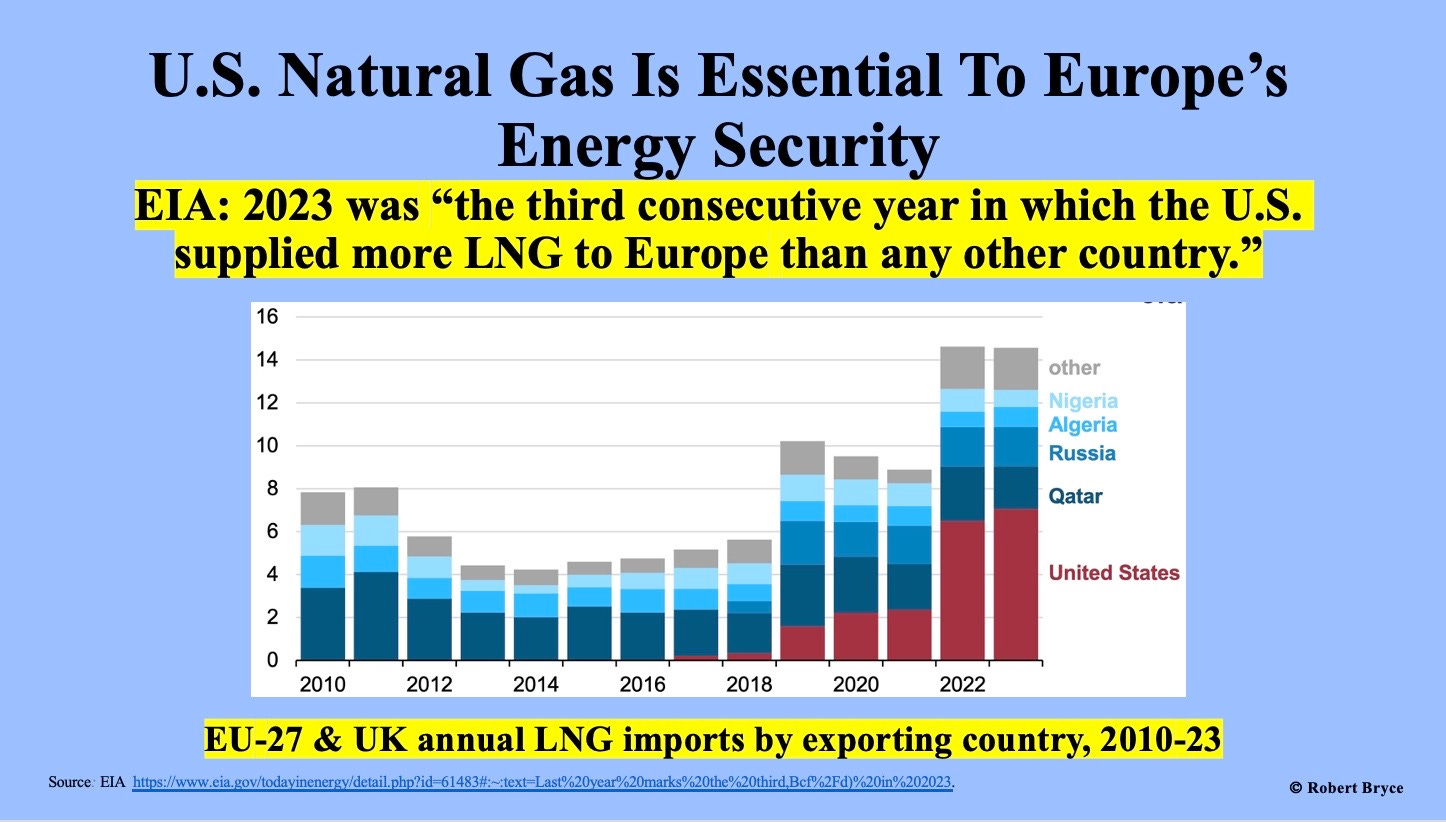
The punchline here is apparent. We are insanely lucky to have such an abundance of low-cost, low-carbon energy. Natural gas is a strategic — and irreplaceable — energy source for the United States and Europe.
Please click that ♡ button, y’all. Thanks.





Cheap natural gas is an incredible boon for America. Gas itself is an irreplaceable raw material that isn't just a fuel source.
So wouldn't it be worthwhile for us to work on pathways that can keep gas cheap and available for as long as possible? Our progeny many generations from now will thank us if we don't use up all of the cheap, reasonably available methane as fast as we can.
Natural gas interests, of course, want us to burn as much as we can now so that they can book their profits and so that their product becomes ever more rare and valuable in the relatively near future decades.
A fair portion of the war against coal has been directly – sometimes openly – funded by natural gas interests like the late Aubrey McClendon. He gave the Sierra Club's "Beyond Coal" campaign $25 M between 2007 and 2010. Those years were at the start of the shale gale that his company – Chesapeake Energy – was working hard to create). Those donations were planned to continue for an indefinite period of time before the scheme was discovered by reporters at Time Magazine.
https://science.time.com/2012/02/02/exclusive-how-the-sierra-club-took-millions-from-the-natural-gas-industry-and-why-they-stopped/
Bloomberg also has substantial interests in the continued prosperity of natural gas. Some of those who want to move as many end users as possible from direct gas consumption in furnaces and stoves know that similar quantities of gas will be burned to supply the electricity that replaces those uses.
Bottom line - gas is great and doesn't deserve to be demonized. Some gas interests, however, don't have humanity's long term interests at heart.
Became a fan of Robert Bryce when I heard him give a keynote address to an API conference that I attended in early 2024. He speaks the truth in plain language with numbers and quotes that cannot be disputed by any rational, honest person.