

The Electric Grid Explained In 10 Charts
The U.S. electric grid delivers $500 billion worth of juice every year. But what is it?
The late German philosopher Martin Heidegger was keen on the “thingness of things.” While researching Heidegger, I stumbled upon an essay by Bill Brown, who studies “thing theory.” In that 2016 essay, Brown writes, “Heidegger concentrates on an object that discloses the thingness of things in its unconditioned autonomy: standing alone and standing forth, the thing things.”
The thingness of things is an apt way to discuss the electric grid because most people have no idea what the damn thing is. That ignorance makes the electric grid an almost perfect subject for hyperbole and big promises.
Last February, the Department of Energy published a report — the “National Transmission Needs Study” — which claimed the U.S. needs to build 47,300 gigawatt-miles of new power lines by 2035. It did not bother to explain what a gigawatt-mile is, nor did it say how many miles of transmission are being built annually. (As I explained last May in “47,300 Gigawatt-Miles From Nowhere,” the answer is very few.)
Last May, the New York Times published an editorial titled “We Desperately Need a New Power Grid. Here’s How to Make It Happen.” It said “To tap the potential of renewable energy, the United States needs to dramatically expand the electric grid between places with abundant wind and sunshine and places where people live and work. And it needs to happen fast.” The Times continued, saying the U.S. needs “a plan to build a new electric grid.”
Last November, Energy Secretary Jennifer Granholm tweeted, “With @POTUS investing in America agenda, we’re giving our electric grid some much-needed TLC.” Granholm was touting the administration’s “largest ever investment in America’s electric grid,” a move that she claimed would result in more “clean energy,” lower costs, and (of course) “union jobs.”
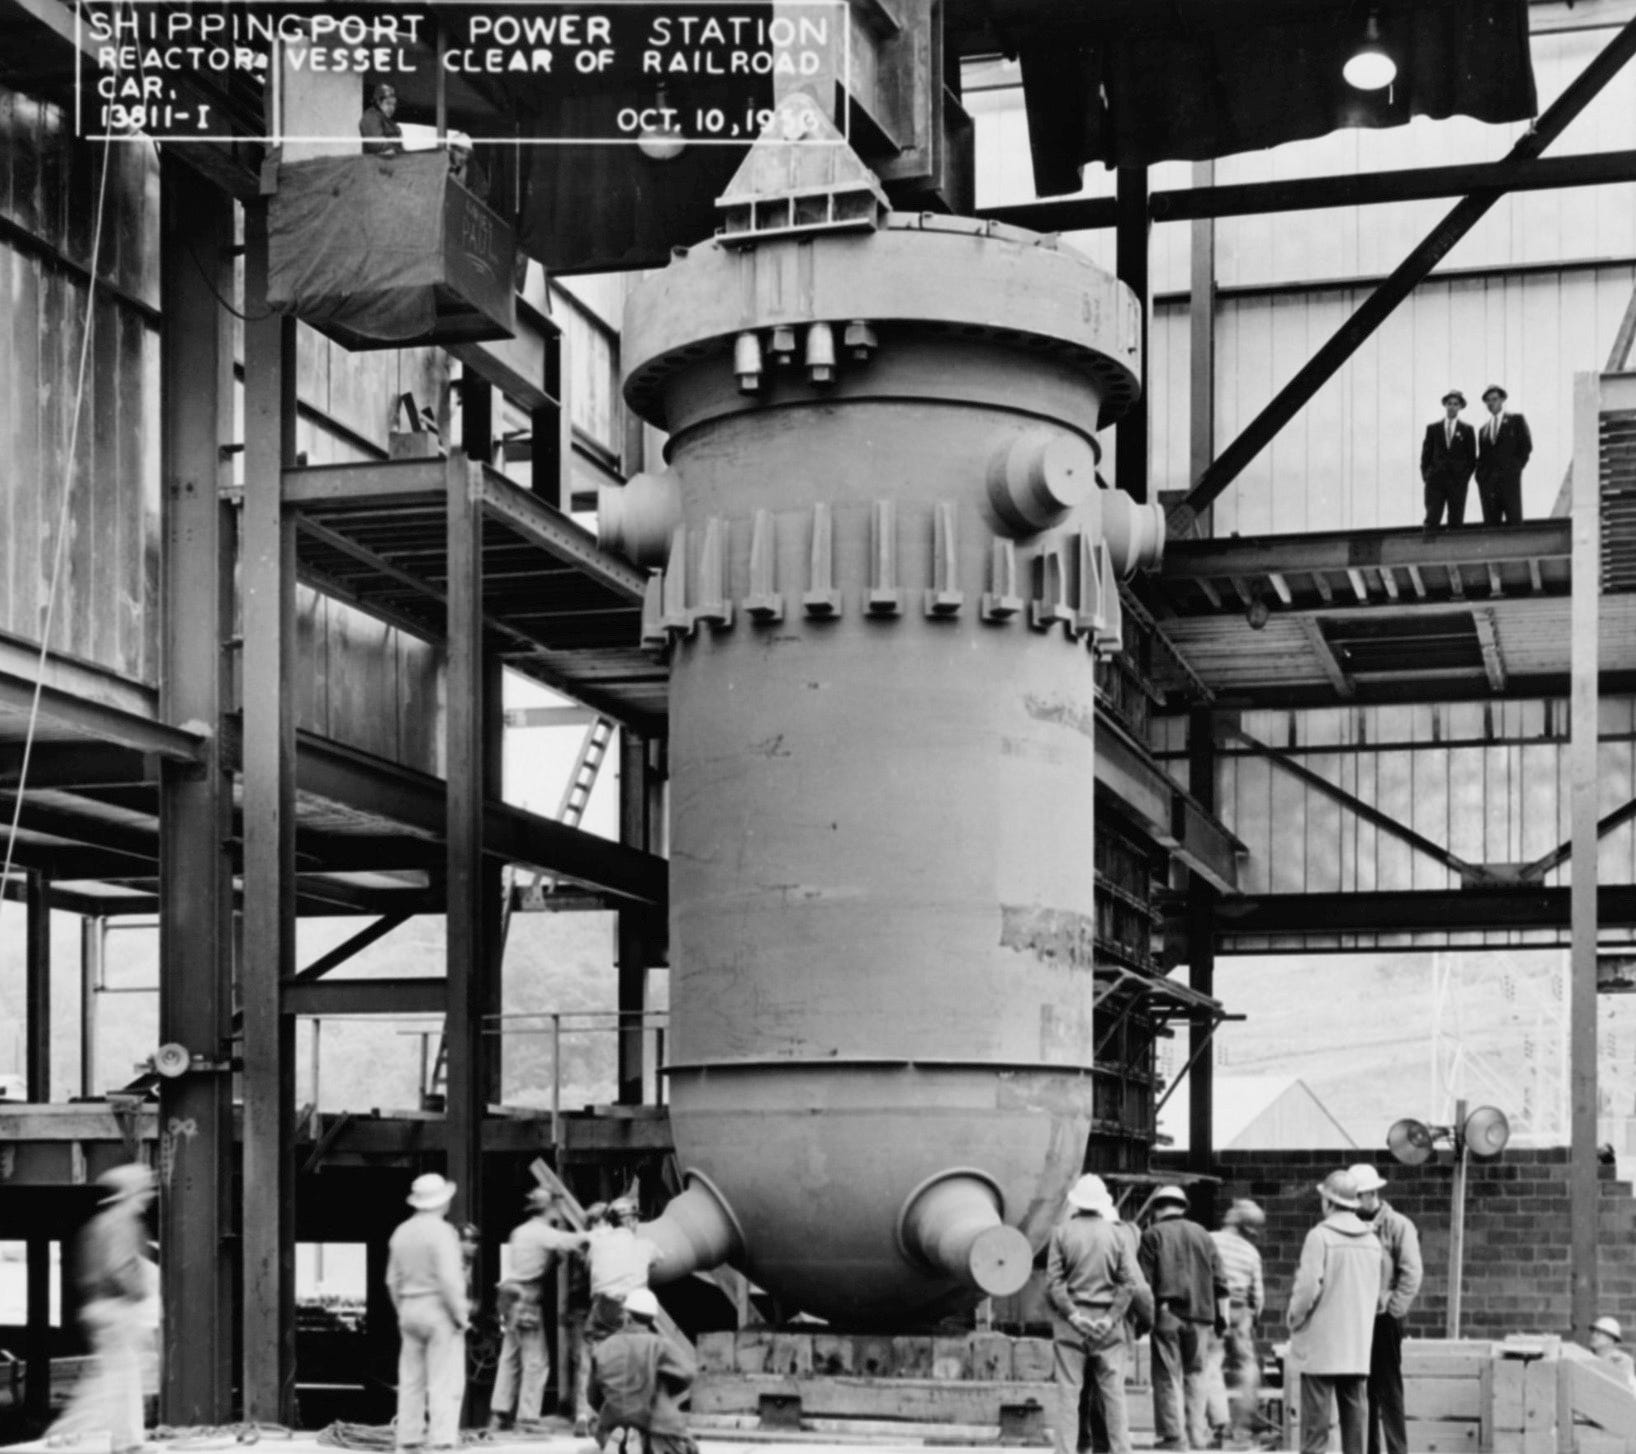
So, what is the electric grid? I like to think of it as the Mother Network. It’s the energy system that fuels our society’s most-critical networks, from hospitals and traffic lights to water systems and the Internet. Meredith Angwin, the author of the landmark 2020 book Shorting the Grid: The Hidden Fragility of Our Electric Grid, has a good definition. She recently told me the grid is “everything that connects us to electricity.” In these charts, I ignore what Angwin calls the “policy grid” and focus mainly on the physical grid — the sprawling network that allows electricity worth $500 billion per year to be generated and delivered to customers from Maine to Hawaii and from Florida to Alaska.
These 10 charts are not the definitive explanation of the electric grid. Instead, they are an effort to help readers understand the thingness of the thing we call the electric grid.
Figure 1
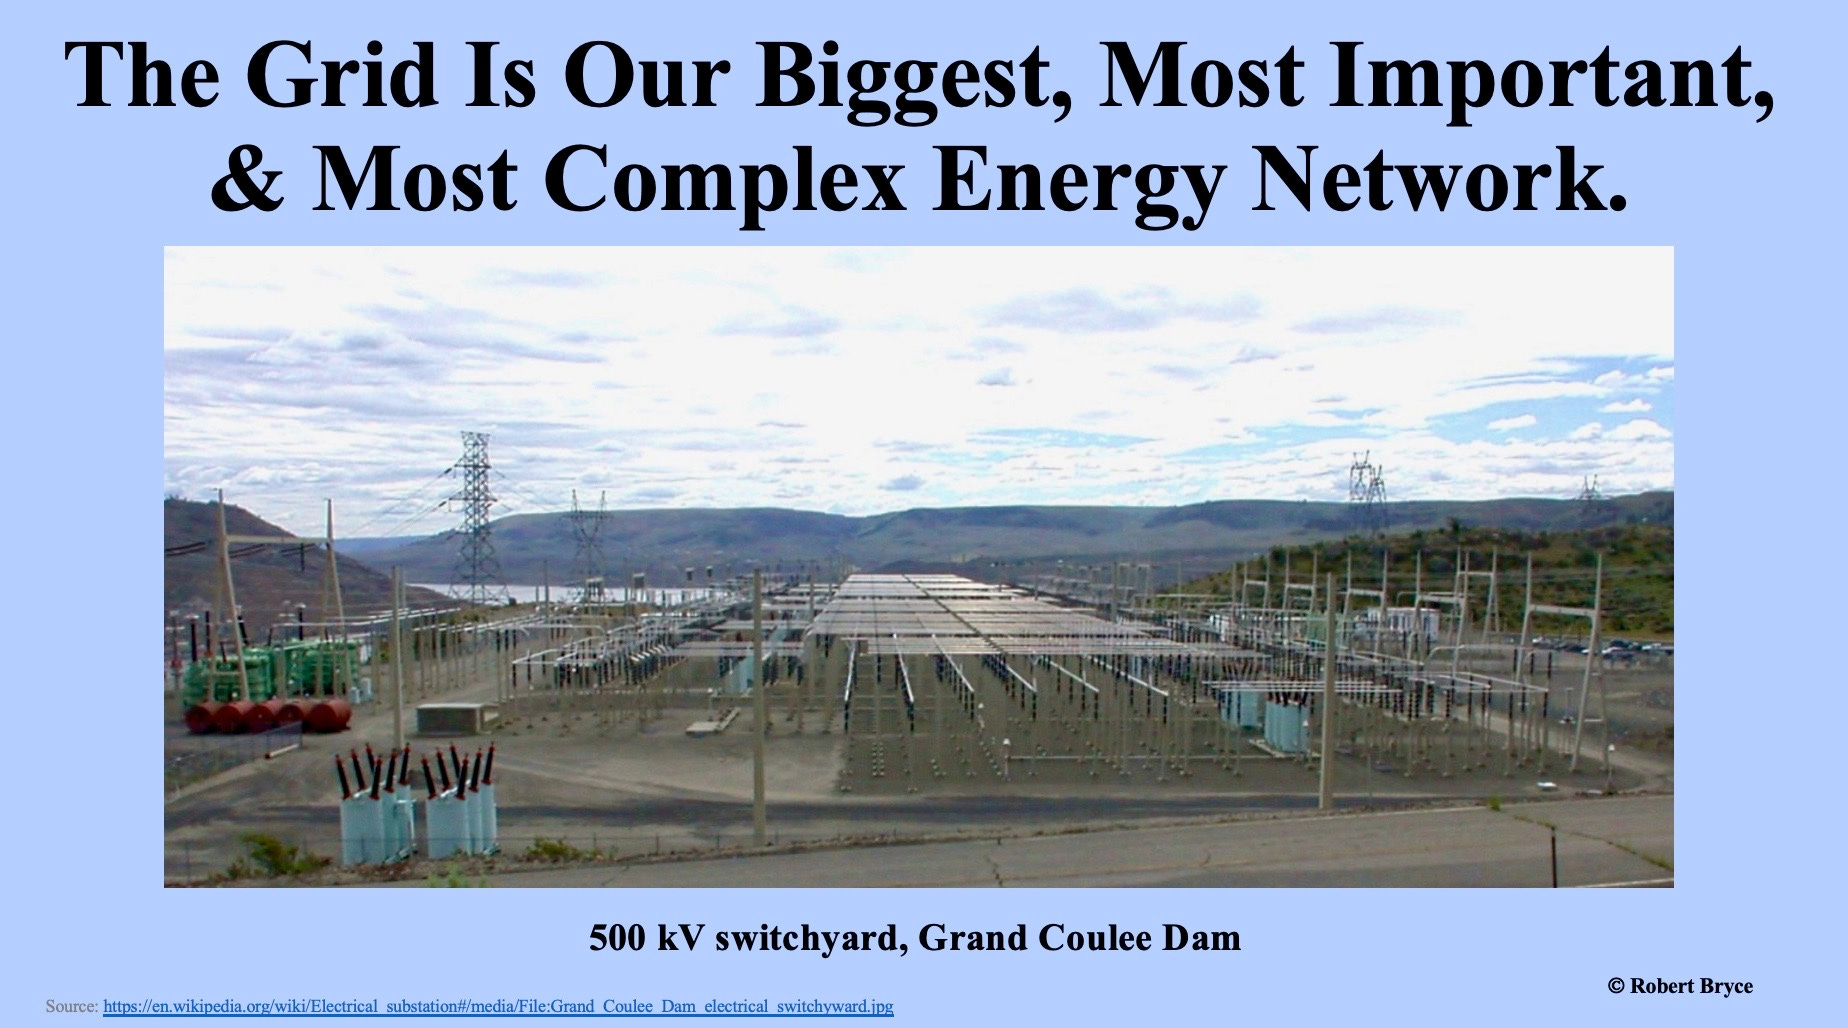
Figure 2
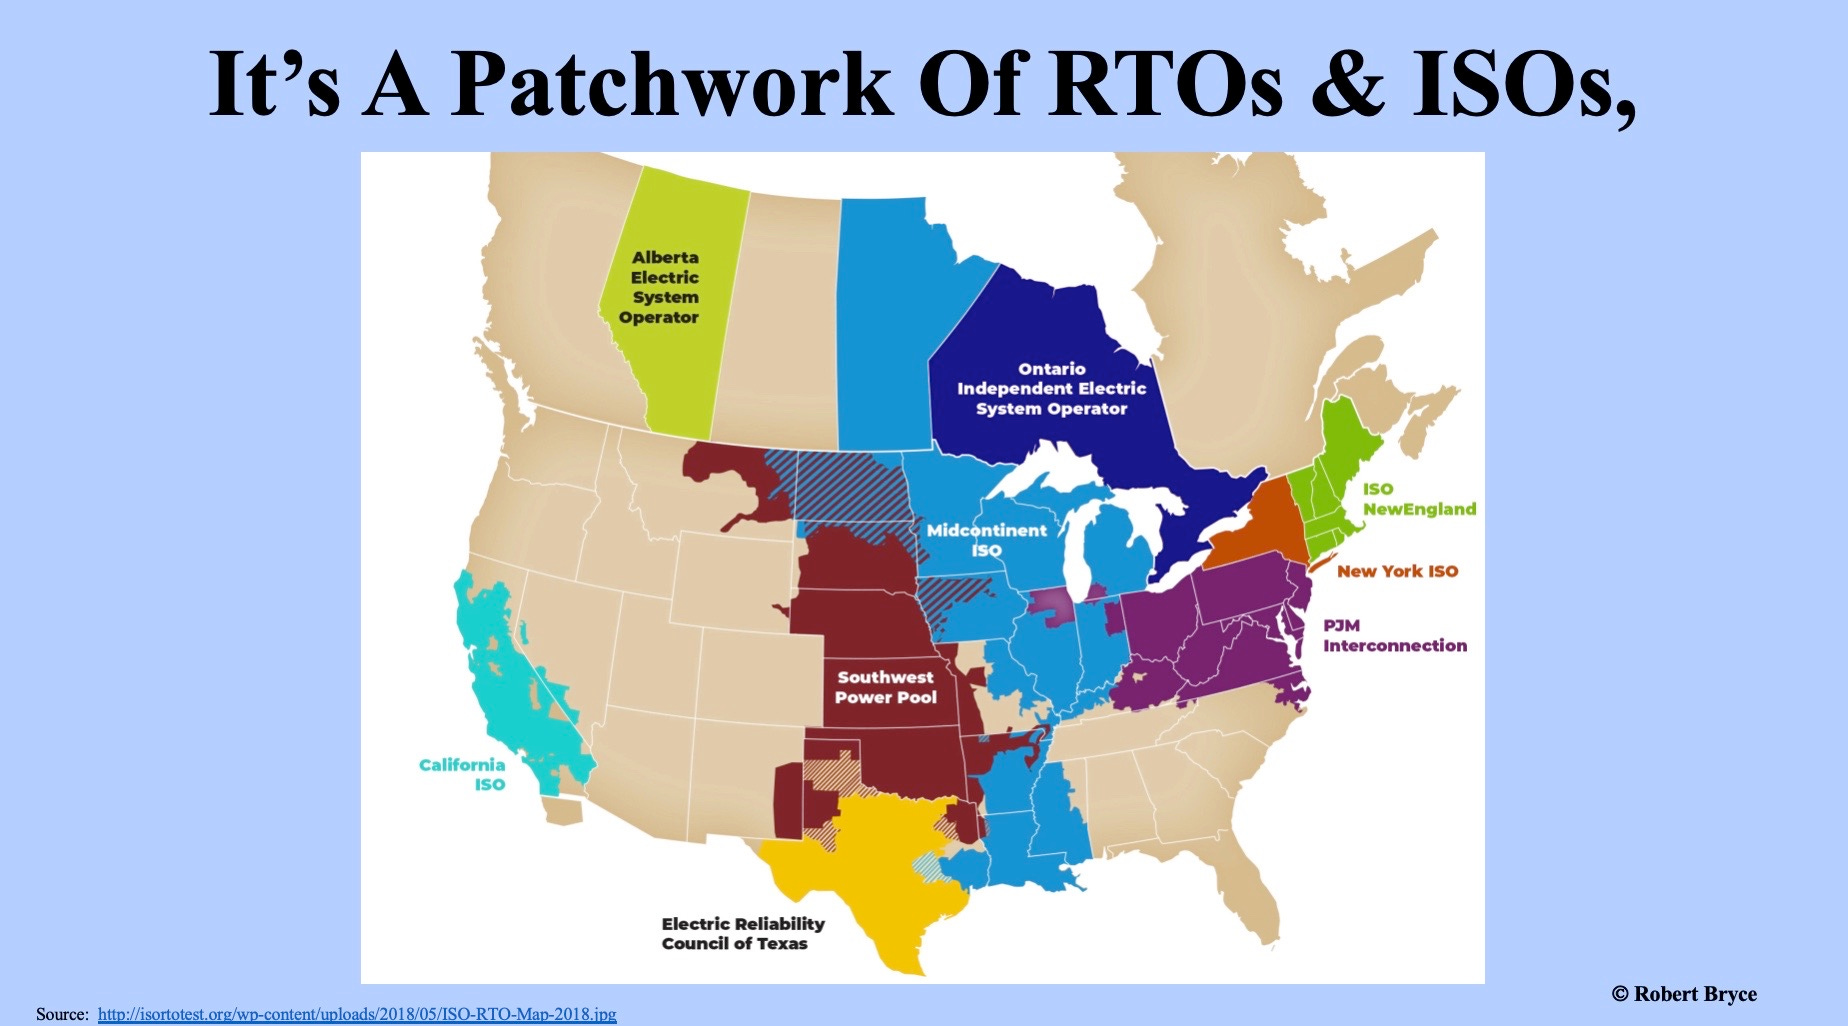
Figure 3
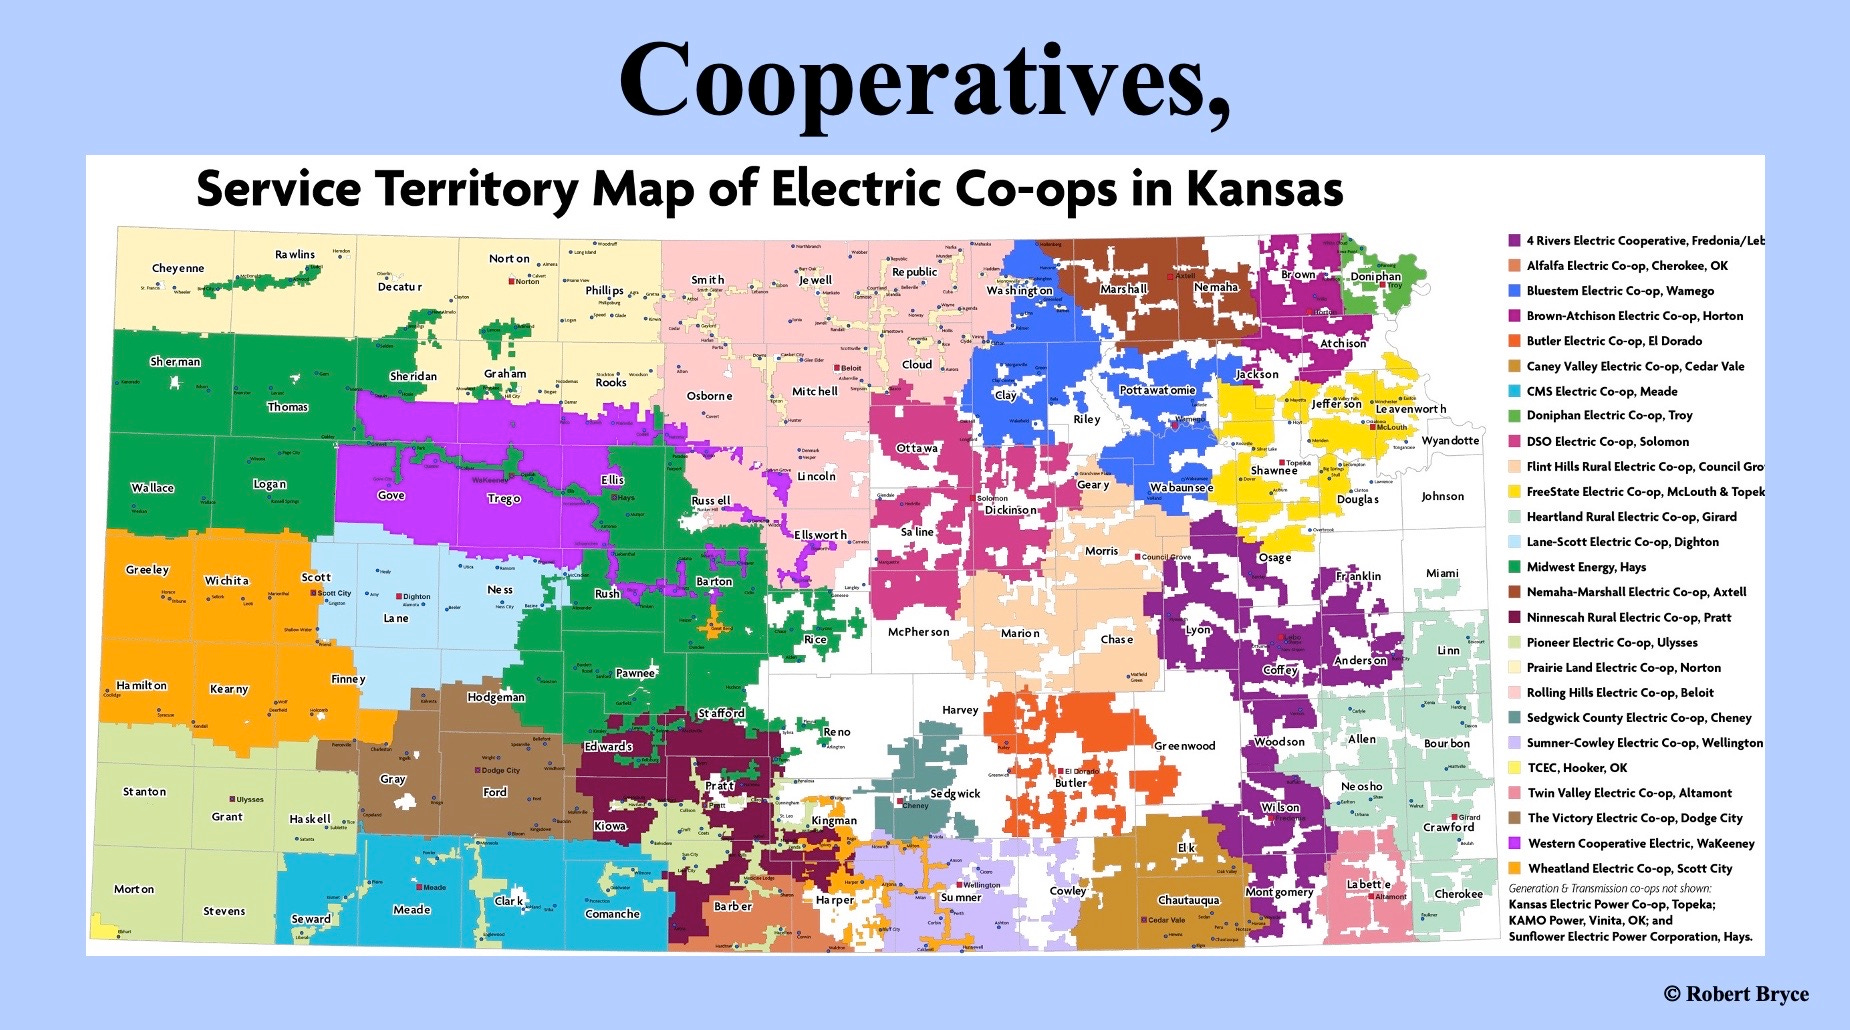
Figure 4
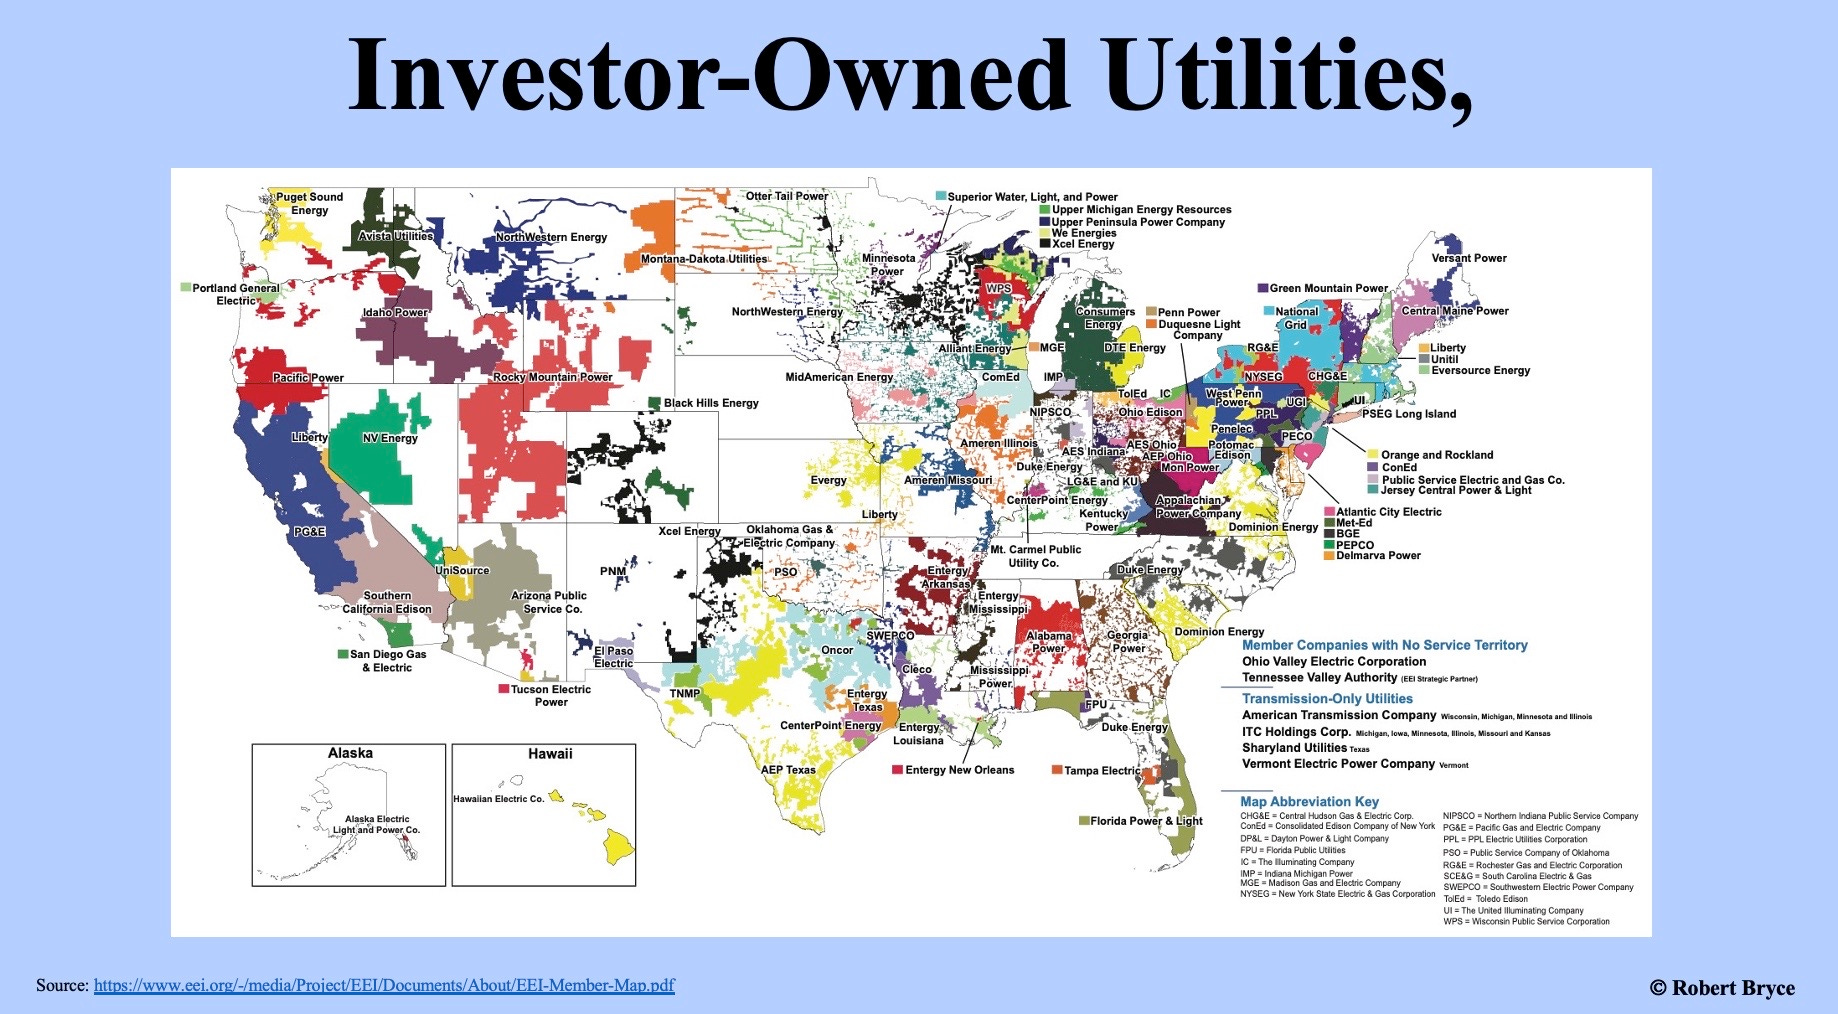
Figure 5
Figure 6
Figure 7
Figure 8
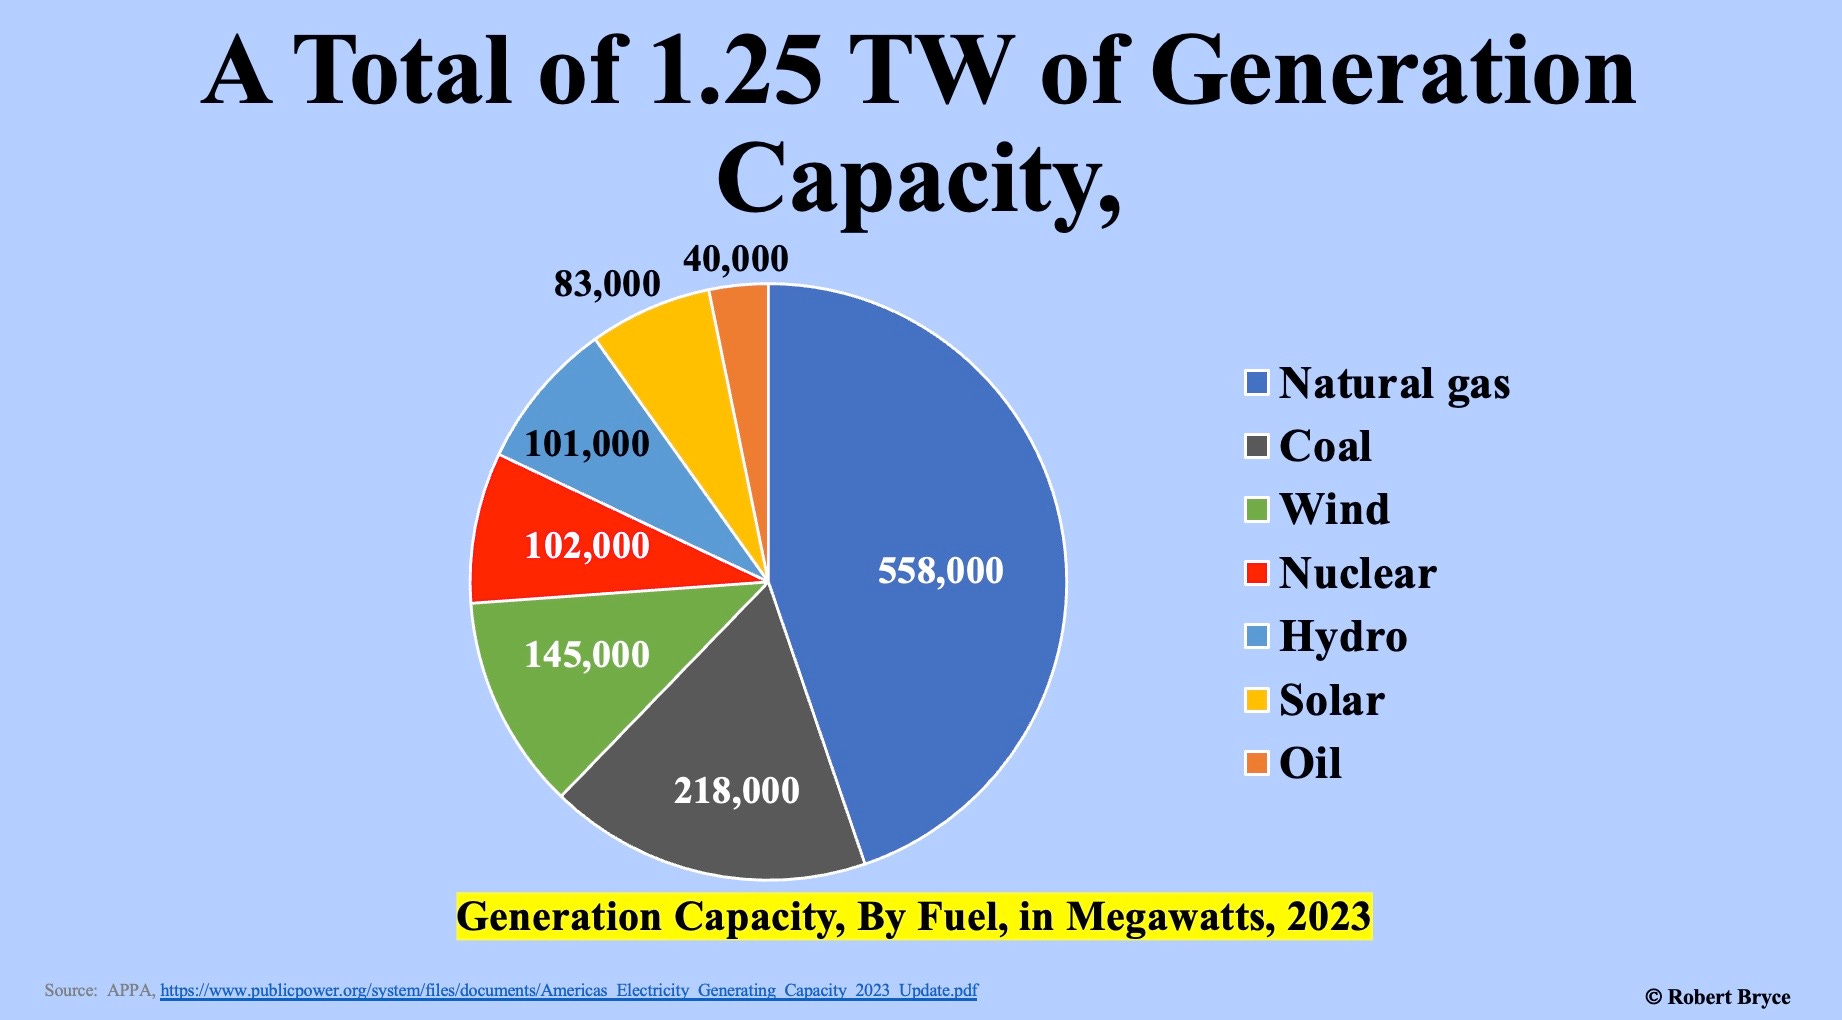
Figure 9
Figure 10
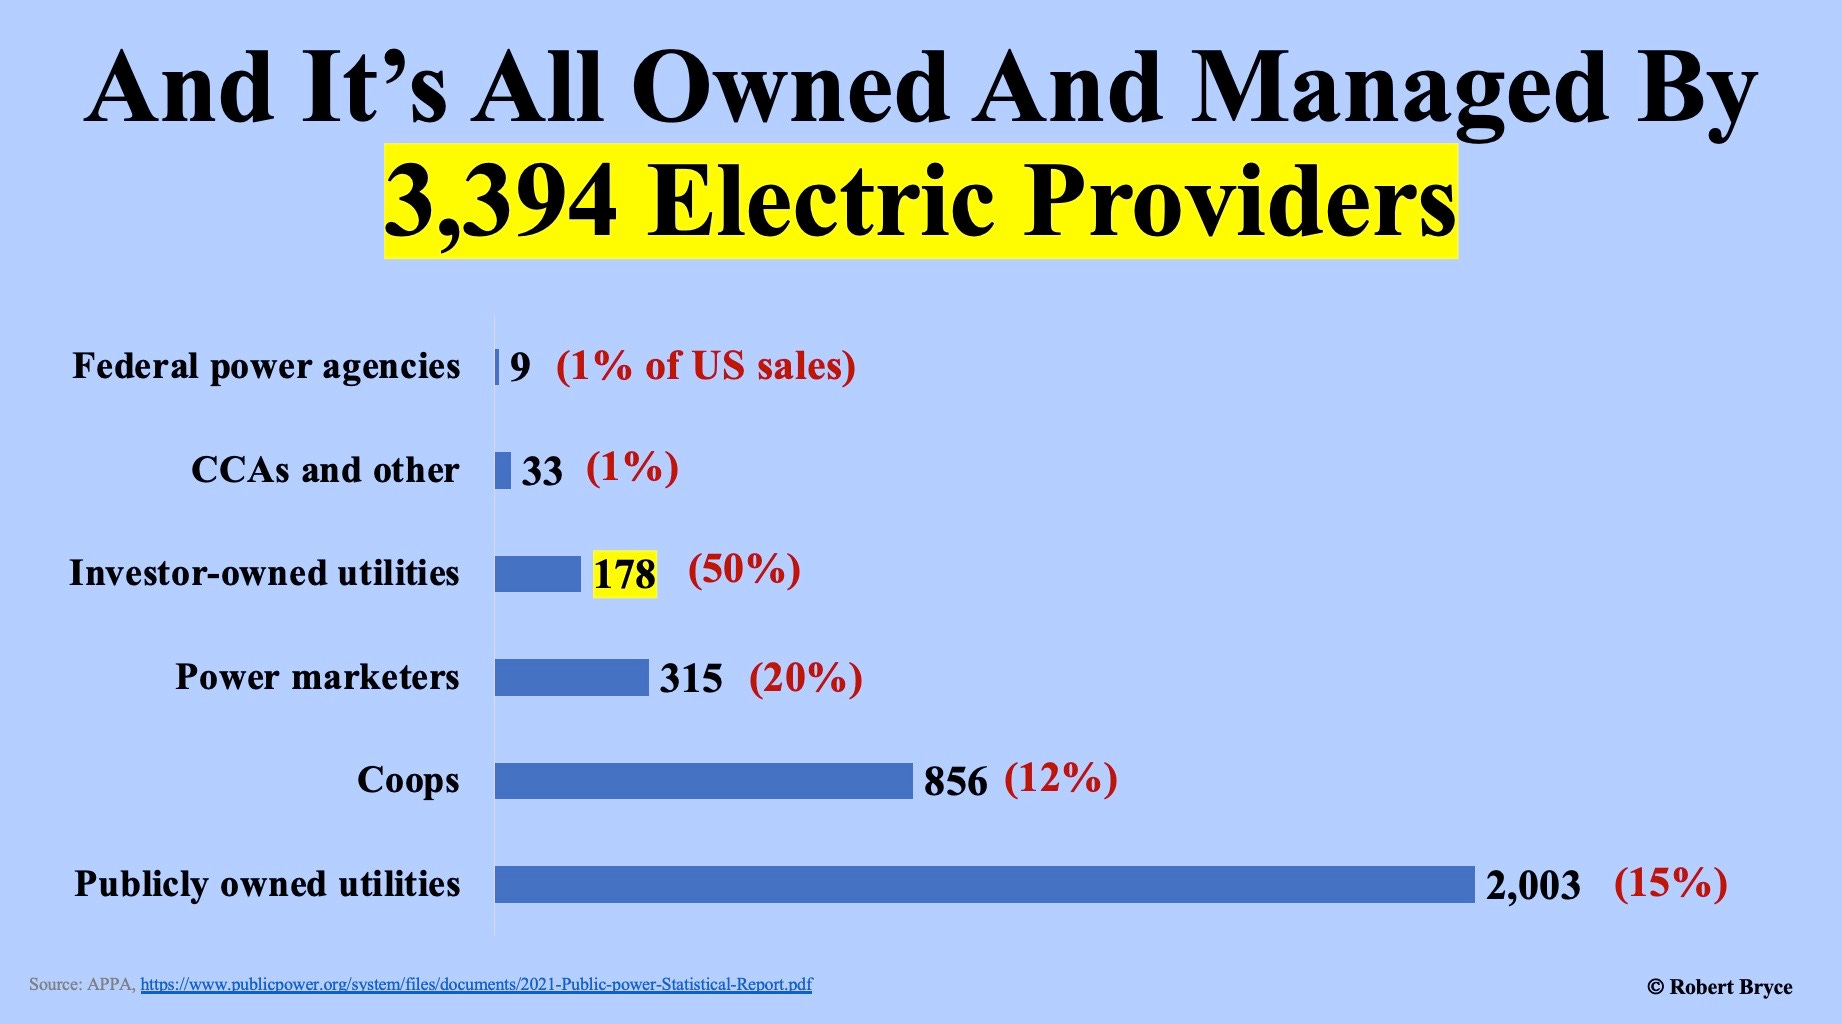
Perhaps the most amazing part of the U.S. electric grid is that somehow — despite its massive size, competing policies, and myriad of different owners — it all works.
Please click that ♡ button and while you are clicking, please subscribe and share.
Thanks 1,000,000.
Thank you for these informative graphs. One suggestion: Add TWh for each source. Capacity is important, but because capacity factors vary, looking at capacity alone is a bit misleading. It's the energy that is produced that matters in the end. A TWh chart would help point out the importance of firm power. Displaying reliability somehow would also be helpful. Just suggestions. I learn so much from you and it helps me communicate in my outreach. Thank you Robert!
Along with the fragility of power delivery grids nationwide, some junctions are critical to keeping it all tied together. Collapse one of those junctions from natural or manmade events and you can lose delivery in many, many places. Few understand just how vulnerable our system is, though weather events the last couple years have exposed weaknesses in the system, it's all but ignored once the lights come back on.
The so called infrastructure bill could have addressed a lot of these vulnerabilities and even hardened and updated transmission capabilities, but instead we're sold solar and wind farms that come nowhere near meeting demand. Everything in modern civilization requires electricity. Refrigeration, heating, hospitals, food manufacture and distribution, water delivery and waste filtration, hospitals, schools, gas stations, refineries, grocery stores, businesses of all types, all depend on reliable, uninterrupted, power delivery. Go thirty days without power for whatever reason and and civilization goes out the door.
The resulting chaos would be biblical.